
Author: Christopher Yip
Date Published: 20 March 2025
20 Sales Dashboards Your Sales Team Needs
Picture this: your sales team is navigating a maze without a map. That’s what it feels like without a sales dashboard. A great dashboard doesn’t just throw numbers at you - it paints a clear picture. It shows how well your team converts leads, the average deal size, and even how many customers stick around...
Key Takeaways
A sales dashboard works like a map for your sales team. It helps track progress and find areas to improve.
Real-time updates let teams notice problems fast and decide wisely.
Charts and graphs make hard data simple to understand quickly.
Custom dashboards let each person see the numbers they need.
Focusing on key numbers avoids mess and keeps teams on track.
Mobile access lets teams check data anytime, boosting work and choices.
Listening to user feedback helps make the dashboard easier to use.
Regular updates keep the dashboard useful and stop data from getting old.
What is a Sales Dashboard?
A sales dashboard is like a control center for your sales team, it gives you a clear, real-time view of how things are going by visually showing key sales metrics and data.
With a well-designed sales dashboard, you can:
Track sales performance at a glance - See revenue, conversion rates, and pipeline progress in real time.
Identify trends and opportunities - Spot rising sales, slow-moving products, or areas that need improvement.
Monitor team productivity - Check individual and team sales targets to ensure everyone stays on track.
Make data-driven decisions faster - No more guesswork, use real numbers to adjust strategies and close more deals.
PRO TIPS:
Research shows that 60% of business users prefer interactive dashboards . Why? Because they’re easier to navigate and more engaging. And when engagement goes up, so does productivity.

Must Have Features of a Sales Dashboard
A great sales dashboard isn’t just about displaying data - it’s about making your life easier. Here are the key features that make a sales dashboard worth using.
| Feature | Description |
|---|---|
| Data Visualization | Let’s face it—staring at rows of numbers feels like trying to read a foreign language. That’s where charts and graphs come to the rescue. A sales dashboard turn boring data into colorful, easy-to-digest visuals. |
| Real-Time Updates | Real-time insights are a game-changer. They let you spot problems before they snowball. For example, if sales drop suddenly, you can investigate and fix the issue right away. |
| Customizability | Not all sales teams are the same. Some focus on closing deals, while others prioritize lead generation. A customizable dashboard lets you tailor the view to fit your team’s unique needs. |
| User-Friendly Interface | Nothing kills productivity faster than a confusing dashboard. I’ve seen it happen - clicking through endless tabs, hunting for that one elusive metric. It’s like trying to find a needle in a haystack. A user-friendly sales dashboard eliminates this headache. It puts everything you need right where you expect it. |
| Integration with Other Software | Manually entering data is a nightmare. It’s time-consuming, error-prone, and downright boring. That’s why a good sales dashboard must be able to integrate with third-party software like CRM, ERP systems, Accounting Software, and more. |
Get Started With SalesHero's Sales Dashboard to Grow Sales
Get quick insight to different sales performance metric to identify opportunities and improvement!
20 Sales Dashboard Examples
Not all sales dashboards are created equal. Each type serves a unique purpose, helping teams tackle specific challenges. Let me walk you through some of sales dashboard examples:
1. Sales Lead Dashboard
A sales lead dashboard enables you to track, monitor, and analyze lead generation efforts in real time. It typically presents key metrics such as total leads generated, lead conversion rates, and lead source analysis.
Additionally, the dashboard provides insights into response time to leads, average conversion time, and lead quality scores. These metrics offer several advantages.
For instance, by identifying slow response times, the dashboard encourages teams to optimize their follow-up processes. Moreover, tracking lead conversion rates helps pinpoint effective sales strategies that can be replicated across the team for better results.
Who's it for: Sales teams, sales managers, marketing teams, business development managers, company executives
Covered KPIs: Total leads generated, lead conversion rate, lead source analysis, response time to leads, leads by stage in the sales funnel, lead-to-opportunity ratio, average time to convert leads, cost per lead (CPL), average quality score, lead follow-up rate, marketing campaign performance, abandoned leads, lead velocity
2. Sales Pipeline Dashboard
A sales pipeline dashboard offers a real-time view of your company's sales pipeline, helping you track prospects as they progress through various stages.
By displaying key metrics such as the number of leads, conversion rates, and the average time spent in each stage, these dashboards make it easier to assess the effectiveness of your CTAs and identify potential obstacles in the buyer's journey.
For example, if a significant number of leads drop off at the proposal stage, it could signal that your proposals need improvement in quality or appeal.
Who's it for: Sales managers, sales representatives, company executives, marketing teams, operations teams
Covered KPIs: Number of leads, sales conversion rates, average time spent in each stage, drop-off rates, sales velocity, deal size/average revenue per deal, win rate, sales funnel leakage, lead response time, follow-up activity, quota attainment, customer acquisition cost (CAC), customer lifetime value (CLV), sales forecast accuracy, pipeline value
3. Sales Manager Dashboard
A sales manager dashboard provides a comprehensive overview of key metrics that help sales managers effectively oversee their teams. It typically includes data on sales revenue, sales growth, and average deal size.
While the specific metrics may vary depending on the company, product, or service, every version of the dashboard equips sales managers with valuable insights to identify trends, track progress, and make strategic sales decisions.
Who's it for: Sales managers, company executives, sales analysts, revenue operations teams
Covered KPIs: Total sales revenue, sales growth, average deal size, sales by region, sales by product/service, sales cycle length, opportunity win rate, lead conversion rate, CAC, CLV, sales rep performance, pipeline value, forecast accuracy, customer satisfaction scores
4. Forecast Dashboard
A forecast dashboard provides data-driven insights to help you anticipate future sales. It does this by analyzing market trends, sales growth, and pipeline value to project potential business outcomes.
This dashboard also aids in optimizing budget allocation by identifying revenue opportunities, market trends, and areas within the pipeline that need investment.
Additionally, it enhances your understanding of consumer behavior and purchasing patterns, enabling you to refine your sales approach. How? By crafting more targeted sales pitches that better engage and resonate with potential customers.
Who's it for: Company executives, sales managers, financial analysts, revenue operations teams
Covered KPIs: Annual projected revenue, forecast accuracy, pipeline value, sales growth forecast, sales quota attainment, deal size/average revenue per deal, sales cycle length, opportunity win rate, lead conversion rates, market trends, resource allocation, anticipated challenges, budget utilization, operational efficiency.
5. Sales Growth Dashboard
A sales growth dashboard provides a clear overview of the factors driving your sales performance. It highlights key growth indicators, such as total revenue, broken down by quarter or year, to show how your business is progressing.
Additionally, this dashboard tracks net profit and customer acquisition trends, helping you identify top-performing products, untapped regional opportunities, and seasonal fluctuations affecting your sales cycle.
With these insights, you can develop strategic marketing initiatives - such as targeted promotions and seasonal product launches—to maximize trends and cater to regional preferences.
Who's it for: Sales directors, sales managers, business development teams, marketing managers, company executives
Covered KPIs: Revenue growth rate, year-over-year (YoY) sales growth, month-over-month (MoM) sales growth, sales by region, sales by product/service line, CAC, CLV, sales team performance metrics, conversion rates, average deal size, sales cycle length, customer churn rate, upsell/cross-sell success rates, market share growth, sales productivity metrics
6. Sales Territory Assignments Dashboard
A sales territory assignment dashboard offers a comprehensive view of sales territories and representative assignments. It provides a summary of sales performance by region, highlighting the key figures driving revenue generation.
By analyzing this data, you can identify trends, high-performing areas, and underserved markets.
Leveraging these insights allows you to optimize territory organization and balance workloads more effectively. You can also reallocate sales resources based on performance metrics and market potential to maximize revenue.
Who's it for: Sales directors, regional sales managers, sales operations managers, business development managers, sales strategists
Covered KPIs: Revenue per territory, market share by territory, account penetration rate, new customer acquisition by territory, customer retention rate per territory, territory coverage ratio, sales rep productivity by territory, opportunity win rate by territory, average deal size per territory, sales cycle length by territory, territory growth rate, cross-selling/upselling success by territory, territory potential vs. actual performance, travel time and costs per territory, customer satisfaction scores by territory
7. Sales Competition Dashboard
A sales competition dashboard allows you to track internal sales competitions in real time, giving employees visibility into team performance. This fosters a competitive spirit, encourages accountability, and boosts workplace morale.
Beyond motivation, these dashboards provide valuable insights into win rates and customer retention metrics, helping you identify bottlenecks in the sales process, such as slow response times.
Additionally, the data from these dashboards enables you to implement solutions like automated follow-ups and set response time targets to enhance overall sales efficiency.
Who's it for: Sales managers, team leaders, sales representatives, sales trainers, performance analysts
Covered KPIs: Total sales revenue, closing ratio, conversion rate, average deal size, sales cycle length, customer acquisition, upselling/cross-selling success, customer retention rate, call/meeting activity, pipeline value, quota attainment, win rate, lead response time, sales velocity, customer satisfaction score
8. Sales Opportunities Dashboard
Identifying sales opportunities can be challenging, but a sales opportunity dashboard simplifies the process by providing a comprehensive view of each potential deal. It tracks key metrics such as deal value, closing probability, expected close date, and the current stage in the sales cycle.
With these insights readily available, sales representatives can allocate their time and resources more effectively. For instance, they may prioritize high-value deals approaching their close date or focus on opportunities with a higher likelihood of success.
Who's it for: Sales managers, sales representatives, business development managers, account executives, sales operations teams
Covered KPIs: Pipeline value, number of open opportunities, average deal size, win rate, sales cycle length, conversion rate by stage, opportunity age, new opportunities created, opportunity by source, opportunity by product/service, opportunity by sales rep, probability-weighted pipeline value, days since last activity, expected revenue by month/quarter, top opportunities by value
9. Sales Product Performance Dashboard
A sales product performance dashboard monitors key metrics such as sales volume, revenue, profit margins, and market share, providing valuable insights into individual product performance.
By analyzing this data, you can identify top-performing products and refine your sales strategies accordingly. This often includes optimizing resource allocation, enhancing promotional activities, and fine-tuning product lines based on data-driven insights.
Who's it for: Product managers, sales managers, marketing managers, business analysts, C-level executives, sales representatives
Covered KPIs: Revenue by product, sell-through rate, profit margin by product, market share by product, product sales growth rate, average selling price, rate of return, cross-sell/upsell rates, sales by region/territory, sales by customer segment, product penetration rate, product lifecycle stage, inventory turnover, product revenue forecast, product contribution to total sales, sales velocity by product, product discount frequency and amount, seasonality trends by product
10. Customer Retention Dashboard
A customer retention dashboard helps you analyze and strengthen long-term relationships with your customers by providing insights into their behavior, satisfaction, and loyalty.
Regularly monitoring this dashboard allows you to spot trends, such as rising churn rates or declining NPS scores. For instance, a surge in customer feedback and complaints may signal the need to reassess your customer service approach.
Likewise, a drop in usage frequency could indicate the need for product updates or new features to enhance engagement and retention.
Who's it for: Customer service managers, marketing teams, account managers, product managers, company executives
Covered KPIs: Churn rate, CLV, repeat purchase rate, net promoter score (NPS), customer satisfaction scores, renewal rates, customer retention cost, upsell/cross-sell rates, customer feedback and complaints, retention rate by customer segment, average customer tenure, time to value, loyalty program participation and impact
11. Sales Rep Dashboard
A sales rep dashboard provides a clear view of each sales representative’s performance, using charts, tables, and graphs to highlight key metrics. These include completed activities, upsell rates, and time spent on selling tasks, helping you assess strengths and areas for improvement.
Monitoring real-time data from this dashboard allows you to refine conversion strategies. By analyzing performance patterns, you can identify best practices from top sellers and implement targeted coaching for underperforming reps.
Additionally, sales managers can leverage this dashboard to enhance sales processes. By analyzing customer interaction data, they can implement high-impact strategies - such as prioritizing early product demonstrations - to boost conversion rates by up to 30%.
Who's it for: Sales representatives, account executives, business development representatives, inside sales reps, field sales reps
Covered KPIs: Individual sales quota attainment, number of deals closed, revenue generated, average deal size, win rate, sales cycle length, pipeline value, activities completed, lead response time, conversion rate by stage, opportunity age, cross-sell/upsell rate, customer retention rate, average discount given, days since last customer contact, number of qualified leads generated, sales forecast accuracy, time spent on selling activities
12. Sales Status Dashboard
A sales status dashboard provides a clear overview of sales targets, regional performance, and overall revenue growth. It offers valuable insights that help you make data-driven decisions to drive sales forward.
For example, the dashboard might show that while total revenue has grown by 15%, the average deal size has dropped by 10%. This could indicate shifts in pricing strategies or changes in customer purchasing behavior.
With this information, you can take timely action to ensure your average deal size aligns with overall revenue growth.
Who's it for: Sales managers, sales directors, VPs of sales, chief revenue officers, CEOs, business analysts
Covered KPIs: Total revenue, revenue by product/service, revenue by region, sales growth rate, total pipeline value, forecasted revenue, average deal size, win rate, average sales cycle length, total number of opportunities, conversion rates by stage, team quota attainment, top-performing products/services, customer acquisition cost, customer lifetime value, market penetration rate, sales velocity, lead-to-opportunity conversion rate
13. Monthly Sales Dashboard
A monthly sales dashboard simplifies tracking your team’s progress by providing a clear overview of performance and business targets. It fosters transparency and alignment across departments by showcasing real-time data.
Additionally, this dashboard enhances workplace efficiency by eliminating the need for time-consuming weekly Excel or Google reports, ensuring up-to-date insights with minimal effort.
Who's it for: Sales teams, marketing teams, management, finance teams
Covered KPIs: Total sales, sales target achievement, new leads generated, CAC, revenue per customer, sales growth, sales by product or service, sales cycle length, customer retention rates, sales rep performance
14. Sales Cycle Length Dashboard
Gain a detailed analysis of your sales cycle with a sales cycle length dashboard. It provides key metrics that offer insights into the duration and efficiency of each stage in your sales process.
Additionally, this dashboard highlights opportunities within the sales pipeline, helping you track progress at every stage.
Most importantly, it monitors conversion rates to identify where drop-offs occur. With these insights, you can refine your approach by implementing targeted follow-ups for stalled deals, offering promotions to attract leads, and enhancing sales rep training with personalized strategies.
Who's it for: Sales teams, sales managers, executives
Covered KPIs: Sales cycle duration, deal size, number of deals closed, stage duration, pipeline velocity, win rate, conversion rate, lead response time, lost deal analysis, sales rep performance
15. Sales Engagement Dashboard
A sales engagement dashboard provides key insights into outbound performance, outreach campaigns, and conversion success across different channels. It typically tracks metrics such as email open rates, response rates, and lead conversion rates.
By analyzing this data, you can identify effective outreach strategies - such as targeted messaging and personalized follow-ups—and refine them for better results.
Additionally, this dashboard helps you assess conversion success across channels, enabling you to make strategic adjustments, like improving closing techniques to shorten the sales cycle.
Who's it for: Sales managers, sales teams, company executives, sales directors
Covered KPIs: Engagement rate, click-to-open rate (CTOR), response rate, call arrival rate, call completion rate, meeting scheduled rate, follow-up activity, sales cycle duration, content engagement, lead conversion rate, touchpoint frequency, time from inquiry to response, prospecting activity, deal win rate, pipeline volume, lead response time, customer satisfaction score
16. Win-Loss Dashboard
A win-loss dashboard provides a clear visualization of win rates, helping you track fluctuations and identify performance trends. It is built on key metrics such as stage analysis, customer feedback, and average deal size.
By making these insights easily accessible, this dashboard supports data-driven decision-making to enhance sales performance.
For instance, you can pinpoint the stage where deals are most frequently lost and implement strategic adjustments to address weak points, ultimately improving win rates.
Who's it for: Sales managers, sales teams, account managers, individual sales representatives, company executives
Covered KPIs: Win rate percentage, loss rate and reasons, average deal size, sales cycle length, deal stage analysis, competitive analysis, customer feedback, sales rep performance, market segment analysis, product/service analysis, lead source analysis
17. Deal-Performance Dashboard
A deal performance dashboard provides a comprehensive view of your sales deals, helping you assess their likelihood of closing or falling through.
Additionally, it tracks pipeline changes over specific time periods, offering valuable insights into deal progression.
Most importantly, by closely monitoring deal health, you can quickly identify and address potential risks. For example, if a deal remains stagnant at a certain stage for too long, it may indicate issues like low buyer engagement or competitive pressure, allowing you to take timely action.
Who's it for: Sales managers, account managers, company executives, sales teams
Covered KPIs: Deal velocity, conversion rates, lead-to-opportunity ratio, pipeline value, stage duration analysis, competitive positioning, customer engagement metrics, sales rep effectiveness, revenue forecast accuracy, product/service performance, channel effectiveness analysis
18. Sales Vs Margin Dashboard
While top-line revenue is important, profitability is the ultimate goal. A sales vs. margin dashboard provides insights into both sales performance and profit margins, offering a clearer picture of financial success.
By tracking key metrics such as gross margin, net profit margin, and cost of goods sold (COGS), this dashboard helps you assess the true profitability of your sales efforts.
Who's it for: Finance teams, sales managers, company executives, business analysts, financial controllers
Covered KPIs: Total revenue, gross margin, net profit margin, cost of goods sold (COGS), average selling price, sales volume, discount rates, profit per product/service, customer acquisition cost, return on sales (ROS), product line profitability, regional profit contribution
19. Consumer Sales Dashboard
A consumer sales dashboard consolidates data on margins, sales, and budgets into a single, intuitive interface. It provides valuable insights across multiple dimensions, including sales rep performance, product sales, and geographical trends by city, state, or region.
For instance, analyzing regional sales data helps you better understand market dynamics and allocate resources more effectively.
Additionally, tracking key sales and budget metrics offers insights into gross profit, operating profit, and net profit, giving you a clearer view of the financial health of your sales activities.
Who's it for: Sales managers, regional managers, company executives, marketing teams, business analysts
Covered KPIs: Total sales, sales by product, sales by rep, sales by city/state/region, profit margins, budget vs. actual sales, customer acquisition cost, conversion rates, average transaction value, customer lifetime value, sales growth rate, inventory turnover, sales targets vs. actual
20. Competitor Analysis Dashboard
A competitor analysis dashboard delivers key insights into your competitors’ performance, market positioning, and strategies. It tracks critical factors such as product offerings, pricing, market share, and marketing tactics, helping you navigate the competitive landscape more effectively.
By monitoring product launches and pricing adjustments, this dashboard enables you to anticipate market trends and refine your offerings accordingly.
Additionally, analyzing market share and growth metrics helps identify competitors’ strengths and weaknesses, allowing you to uncover new opportunities for your sales team while proactively addressing potential threats.
Who's it for: Sales managers, product managers, marketing teams, business development executives, strategic planners, company leadership
Covered KPIs: Competitor market share, competitor product offerings and features, competitor pricing strategies, competitor sales growth rates, share of voice (social media and online presence), customer satisfaction scores (if available), competitor marketing campaigns and channels, SWOT analysis, competitor partnerships and alliances, patent and innovation tracking, competitor financial performance, geographic presence and expansion, customer demographics and target markets, sales team size and structure, distribution channels used
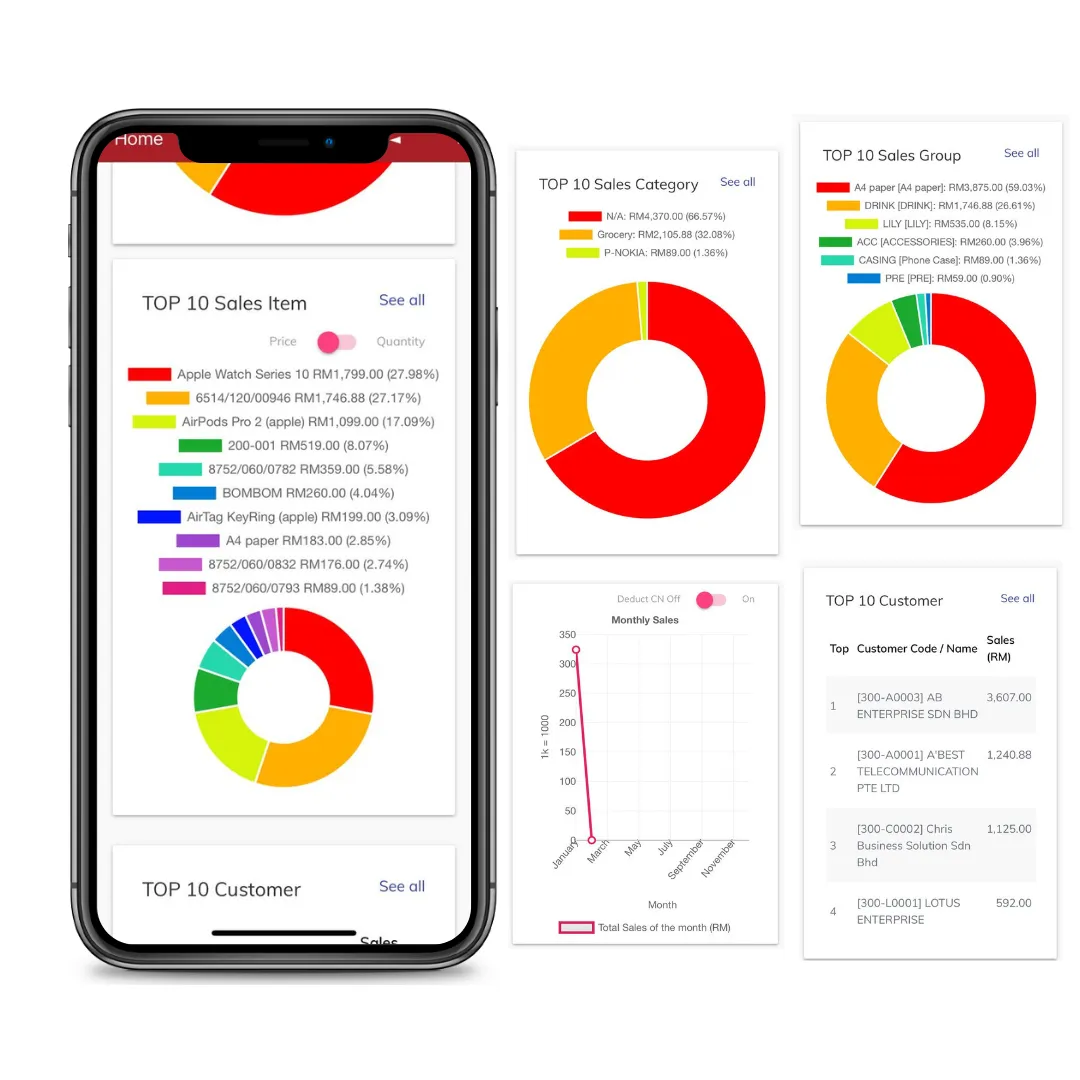
Sales Dashboard Example (Source: Canva)
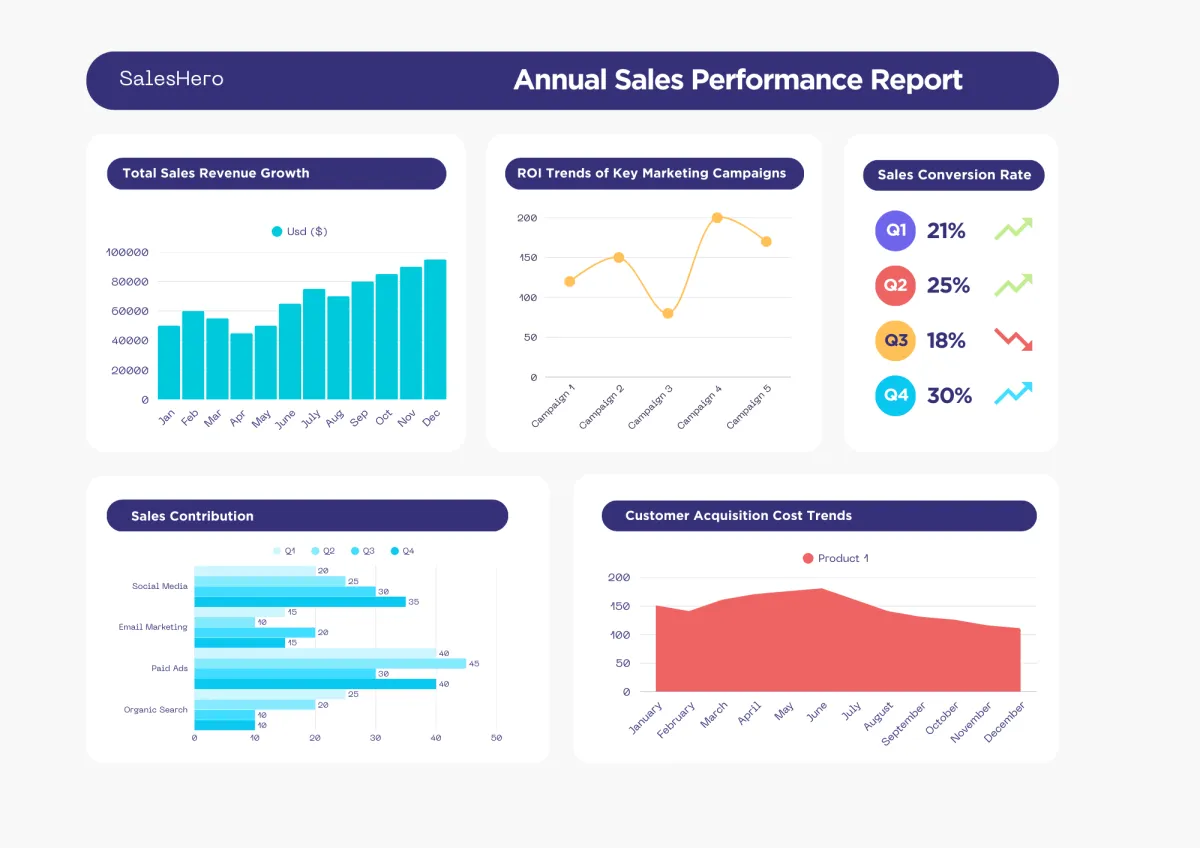
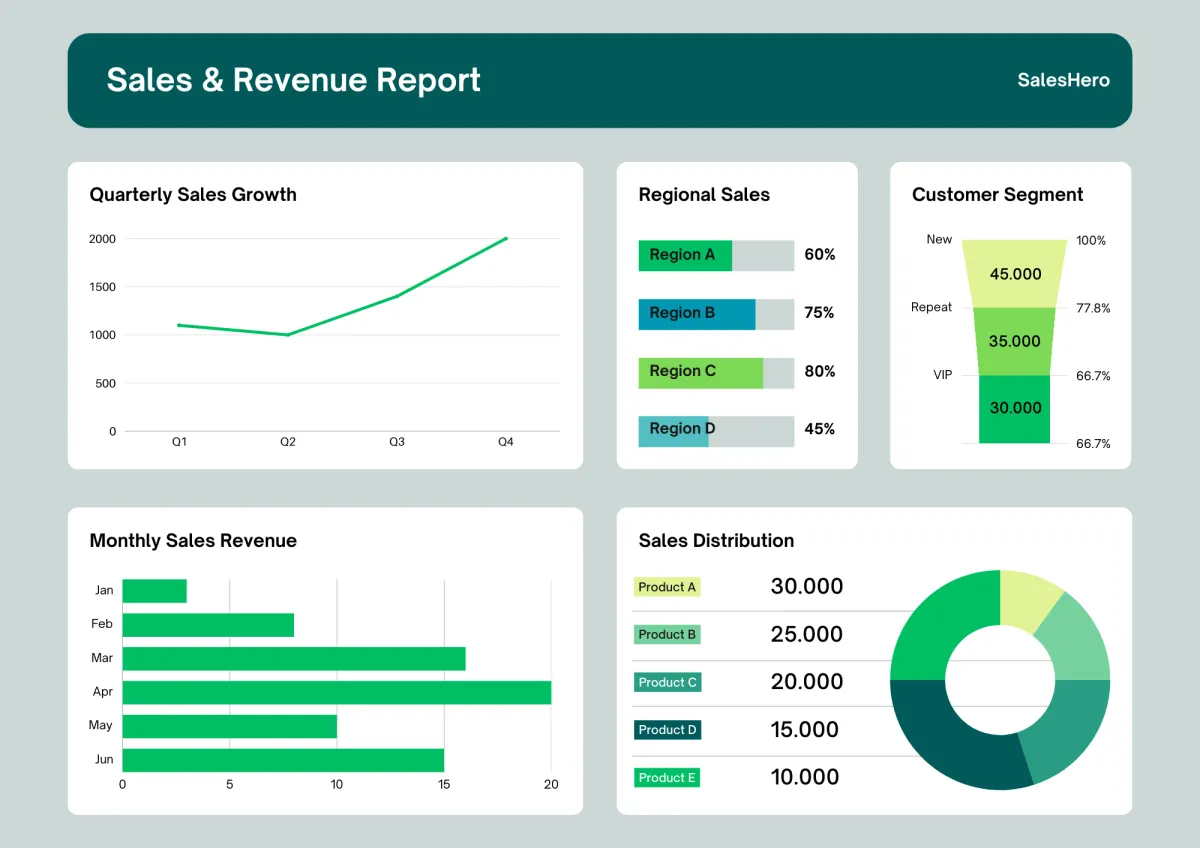
Sales Dashboard Example (Source: Canva)
How to Build a Sales Dashboard?
Creating a sales dashboard doesn’t have to be complicated. No matter what tool you use, the process is pretty much the same: decide what you want to track, pick a tool that can track it, sync your data, and set up dashboards your team can actually use.
1. Figure out what you want to track
Start with your sales goals. Maybe you’re aiming for $1 million in sales this year. Great! Now break it down into key numbers that support that goal. Think about things like:
✅How many leads are coming in?
✅How many are moving through the pipeline?
✅What is the total value of the deal?
Tips: Try to stick to three or four key metrics per goal. Too many, and it gets overwhelming fast.
2. Decide who needs to see what
Some dashboards are for everyone, like overall sales performance. Others, like high-level revenue tracking, might only be relevant for managers. Make sure each dashboard is useful to the people who will actually use it.
3. Pick the right tool
Many CRMs and analytics tools have built-in dashboards that you can set up in just a few clicks. The best ones let you customize your dashboards based on roles, so your team sees only what matters to them.
4. Connect your sales data
If you’re adding a new analytics tool, make sure it syncs well with your CRM or other systems. Ideally, it should update in real time so you’re not stuck with outdated numbers.
5. Build and share your dashboards
Follow your tool’s setup steps, create your dashboards, and share them with the team. Keep them simple and focused so everyone can get the insights they need!
Get in touch
Supercharge Your Sales Team Performance With SalesHero!
8 Best Practices for Designing and Maintaining an Effective Sales Dashboard
Finally, for a sales dashboard to be truly effective, it needs to be clear, actionable, and easy to navigate. Here are some of the simple yet powerful tips to design a dashboard that keeps your sales team on track, along with best practices to ensure it stays relevant as your business grows.
1. Keep it Simple
Focus on the most relevant sales metrics to avoid clutter. Too much data can be overwhelming and reduce clarity.
2. Use a clean layout
Organize information logically, group related metrics, and use whitespace effectively for easy readability. A well-structured dashboard improves efficiency.
3. Design for your users
Sales reps need personal performance trackers, while managers require team-wide insights. Tailoring dashboards to their needs ensures everyone gets relevant data without unnecessary complexity.
4. Highlight key metrics
Place the most important KPIs, like revenue, pipeline value, and conversion rates, in prominent positions so users can spot trends and take action quickly.
5. Make it accessible
Ensure dashboards work seamlessly on all devices, including mobile, so users can check updates anytime, anywhere. Integration with collaboration tools enhances usability.
6. Use visuals wisely
Graphs, charts, and tables simplify complex data, making it easier to spot patterns, compare numbers, and identify outliers at a glance.
7. Enable customization
Give users the flexibility to tailor their dashboards based on their roles or priorities. This keeps their focus on the most relevant data.
8. Keep data fresh
Automate real-time updates so dashboards reflect the latest numbers. This ensures accuracy, especially as sales teams grow or market conditions shift.
Mail
Facebook
LinkedIn
X
Pinterest