

If you want the short answer: Microsoft Power BI and Zoho Analytics suit most Malaysian small and mid-sized businesses, Looker Studio and Metabase are the best free starting points, and Tableau, Qlik Sense and IBM Cognos Analytics are where you go when reporting becomes a company-wide discipline rather than one person's spreadsheet.
Business intelligence tools collect data from the systems you already run, your accounting software, your sales app, your warehouse system, and turn it into dashboards and reports you can act on. The hard part is not finding one. It is finding one your team will actually open on a Monday morning, at a price that still makes sense when you add the fifth and tenth user.
This guide compares 21 business intelligence tools on what actually decides the purchase: what each one costs, who it is built for, and where it stops being a good fit. Pricing was rechecked against vendor pricing pages in September 2026, and every figure below links to the page it came from.
Key takeaways
- You can start for nothing. Looker Studio, Power BI Desktop and Metabase open source are all genuinely free, and Zoho Analytics has a permanent free plan for 2 users.
- Price the tool at twenty users, not two. Per-user plans such as Power BI look cheap at first and compound; Qlik Sense and Klipfolio include users in the plan instead.
- Zoho Analytics bills Malaysian customers in ringgit, from RM96 per month, which removes currency risk at renewal.
- Half the market has quote-only pricing. Sisense, Domo, Yellowfin, SAP BusinessObjects, Strategy One, SAS and Spotfire publish no price, so budget for a sales cycle.
- Check where your data lives before you shortlist anything. That single question eliminates most of this list faster than any feature comparison.
Important: BI pricing moves. Microsoft raised Power BI Pro from US$10 to US$14 per user per month in April 2025, and several tools on the original version of this list have since been renamed or acquired. Treat the prices here as a starting point for your shortlist, then confirm the current rate on the vendor's own pricing page before you commit to an annual contract.

The 21 business intelligence tools at a glance
Start here. Find the row that matches your team size and budget, then read the full entry further down. Prices are the lowest published starting rate for each vendor as of September 2026, and "Quote" means the vendor does not publish a price and will ask you to talk to sales.
| Business intelligence tool | Best for | Starting price (Sept 2026) | Free option |
|---|---|---|---|
| HeroDashboard | Malaysian small and medium enterprises (SMEs) wanting it built for them | Quote | Free demo |
| Zoho Analytics | Small teams that want to be billed in ringgit | RM96 per month, 2 users, billed yearly | Free plan, 2 users |
| Microsoft Power BI | Excel-heavy and Microsoft 365 teams | Free desktop, US$14 per user per month for Pro | Free desktop and free account |
| Looker Studio | Free reporting on Google Ads, GA4 and Sheets | Free, US$9 per user per project per month for Pro | Free |
| Metabase | Teams with light SQL skills that want to self-host | Free open source, US$100 per month hosted | Free open source |
| Klipfolio (Klips) | Multi-source metric dashboards and agencies | US$120 per month, billed yearly | Free trial |
| Clear Analytics | Finance teams that will not leave Excel | Quote | Demo |
| Tableau | Visual analysis and data storytelling | US$15 per user per month, Standard edition | Free trial |
| Qlik Sense | Exploring relationships across many data sources | US$300 per month for Starter, billed yearly | Free trial |
| Domo | Wide data integration on a single cloud platform | Quote | Free trial |
| Sisense | Embedding analytics inside your own product | Quote | Demo |
| Yellowfin | Automated insight detection and data stories | Quote | Free trial |
| Logi Symphony (was Dundas BI) | Software vendors embedding dashboards | Quote | Demo |
| IBM Cognos Analytics | Governed enterprise reporting with AI assistance | US$10.60 per user per month for Standard | Free trial |
| Oracle Analytics Cloud | Businesses already running Oracle databases or applications | Published rate card, quote to confirm | Free trial |
| SAP BusinessObjects | SAP-centric enterprise reporting estates | Quote | Demo |
| Strategy One (was MicroStrategy) | Very large, tightly governed deployments | Quote | Free trial |
| SAS Viya | Advanced statistics and predictive modelling | Quote | Free trial |
| Spotfire | Real-time, streaming and IoT-heavy analysis | Quote | Free trial |
| Mode (part of ThoughtSpot) | Analysts working in SQL, Python and R | Quote | Free trial |
| Atlassian Analytics | Reporting on Jira and Confluence data | Included with Atlassian Cloud Enterprise | Enterprise plans only |
If your reporting problem is really a sales reporting problem, it is worth reading our breakdown of the 20 sales dashboards your sales team needs before you buy any platform. Knowing which dashboards you want makes the tool choice much easier.
How we compared these business intelligence tools
We build and run reporting software for Malaysian wholesalers and distributors, so this list is written from the buyer's side of the table. For each tool we checked the vendor's own pricing and documentation, the lowest tier a real small business could actually start on, and the point at which the tool stops being a fit. Where we use a product ourselves, we say so.
Four things decided the ordering, in this priority: total cost at five and at twenty users, how much technical skill a first dashboard demands, how well the tool connects to the systems Malaysian small and medium enterprises (SMEs) actually run, and whether support is reachable from a GMT+8 timezone.
What changed since this guide was first published
This article was first published in December 2024. The BI market moved a lot in the meantime, and several entries needed correcting rather than refreshing:
- Power BI got more expensive. Pro went from US$10 to US$14 per user per month and Premium Per User from US$20 to US$24, effective 1 April 2025.
- MicroStrategy is now Strategy. The company rebranded in February 2025 and the analytics platform is sold as Strategy One.
- Dundas BI is now Logi Symphony. insightsoftware acquired Dundas and folded the product into its unified Logi Symphony platform.
- Mode is part of ThoughtSpot, which acquired it in 2023.
- Google Data Studio has been called Looker Studio since 2022. If a comparison guide still calls it Data Studio, it has not been updated in years.
- TIBCO Spotfire is now just Spotfire, sold by Cloud Software Group after the TIBCO and Citrix merger.
- The Atlassian Analytics pricing in the original version of this article was wrong. The figures quoted were Jira's plan prices. Atlassian Analytics is included with Atlassian Cloud Enterprise and is not sold as a standalone per-user product.
Best business intelligence tools for small and mid-sized businesses
These seven are the realistic shortlist if you have fewer than about fifty staff, no dedicated data analyst, and a budget that has to survive a finance review. Every one of them can produce a working dashboard within a week.
1. HeroDashboard
HeroDashboard is our own business intelligence dashboard, built for Malaysian wholesalers and distributors who want live sales, stock and collection numbers without assembling the reporting stack themselves. It pulls from the systems those businesses already run and presents the result as dashboards the sales and operations teams can read without training. We are listing our own product here, so weigh this entry accordingly and compare it against the alternatives below.
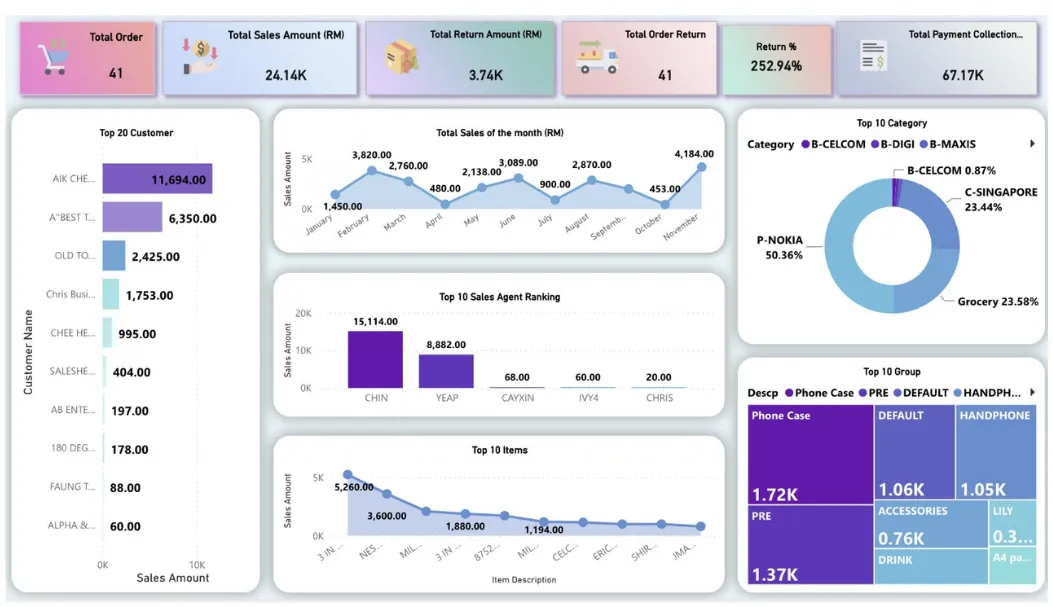
Strengths: built for non-technical users, set up with your data rather than handed over as an empty canvas, local support in Malaysian business hours, and pricing scaled for smaller companies.
Limitations: it is focused on distribution and sales operations, so it is not the right answer for a research team that needs statistical modelling. There is no public price list.
Pricing: quote-based. Request a demo for current pricing.
2. Zoho Analytics
Zoho Analytics is the strongest value pick for a Malaysian small business, for one reason most comparison articles miss: Zoho prices in ringgit for Malaysian customers, so there is no currency exposure at renewal. It handles automatic data syncing from a long list of business apps, and its report builder is approachable for anyone comfortable in a spreadsheet.
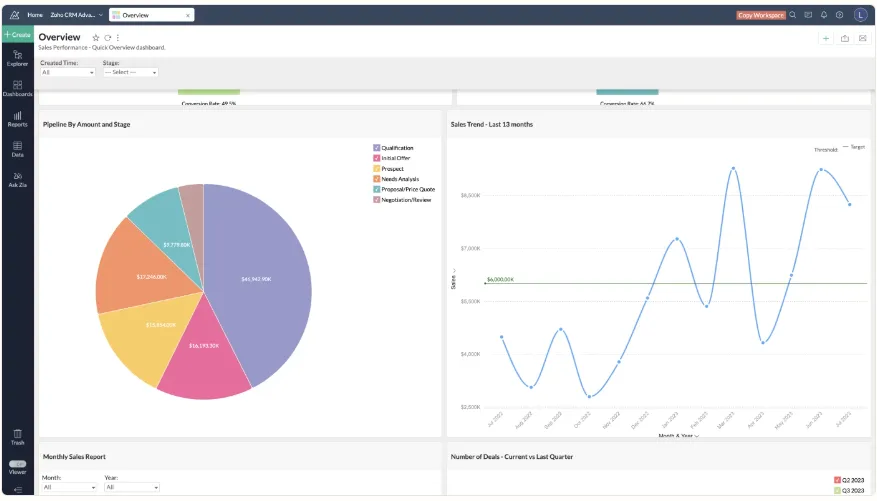
Strengths: a genuine free plan for 2 users and 10,000 rows, ringgit pricing, built-in AI assistance, a strong connector library, and an on-premise option.
Limitations: the interface feels dated next to Power BI or Tableau, and the row limits on the lower tiers arrive faster than new buyers expect.
Pricing: free plan for 2 users. Basic RM96 per month (2 users, 0.5 million rows), Standard RM192, Premium RM460 and Enterprise RM1,820, all billed annually. See Zoho Analytics pricing.
3. Microsoft Power BI
Power BI is the default choice for any business already standardised on Microsoft 365, and it is the tool you will most easily hire for in Malaysia. Power BI Desktop is free to build in, which means you can prove the business case before paying anything. You only start paying when you want to share those reports with colleagues.
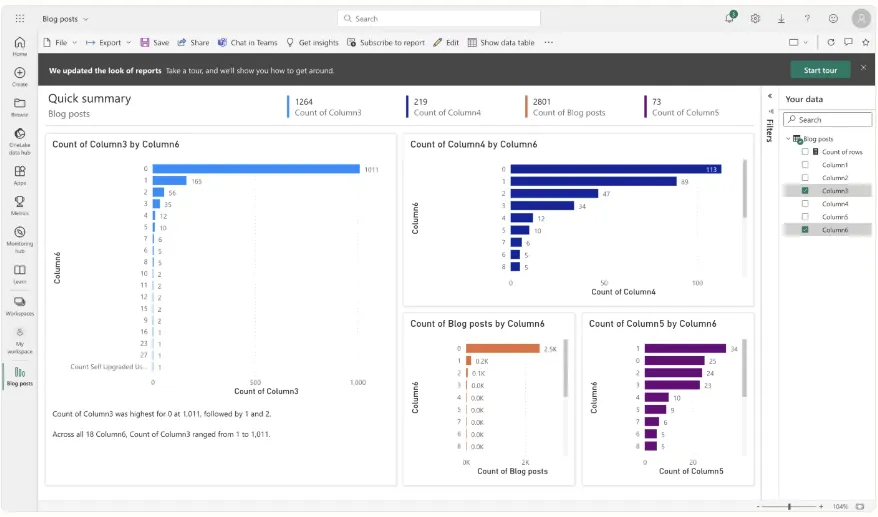
Strengths: free desktop authoring, deep Excel and Microsoft 365 integration, the largest hiring pool of any BI tool, and a very wide connector list.
Limitations: sharing needs a paid licence for every viewer until you reach Microsoft Fabric F64 capacity, which is far beyond an SME budget. Large models can be slow to refresh, and Microsoft raised the per-user price from US$10 to US$14 in April 2025.
Pricing: free account and free Power BI Desktop. Pro is US$14 per user per month and Premium Per User is US$24, both billed yearly. See Power BI pricing.
4. Looker Studio
Looker Studio, called Google Data Studio until 2022, is the fastest way to get a shareable dashboard online for nothing. If most of the data you care about sits in Google Analytics 4, Google Ads, Google Sheets or BigQuery, you can have a live report running in an afternoon with no licence at all.
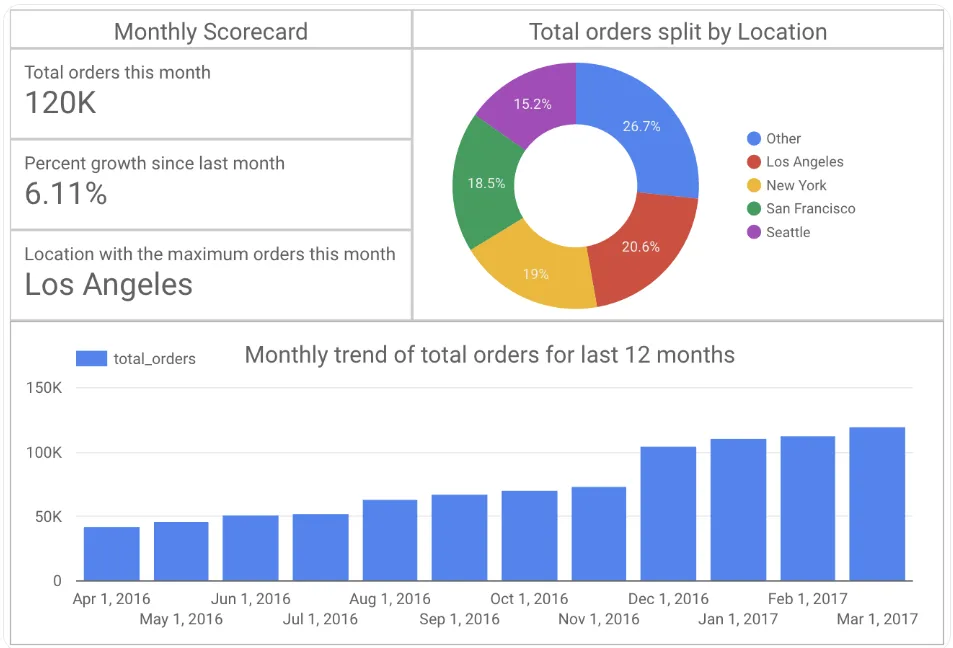
Strengths: free for the core product, instant setup with a Google account, easy sharing, and a large community template library.
Limitations: connectors outside Google's ecosystem usually need a paid third-party connector, report formatting is fiddly, and performance drops on large datasets. Pro is billed per Google Cloud project, which catches out agencies running one project per client.
Pricing: free. Looker Studio Pro is US$9 per user per project per month. See Looker Studio.
5. Metabase
Metabase is the best open-source option on this list. The self-hosted edition is genuinely free for unlimited users, which makes it the cheapest way to give a whole company read access to its own numbers, provided you have someone who can run a server. Its question builder lets non-technical staff ask straightforward questions without writing SQL.
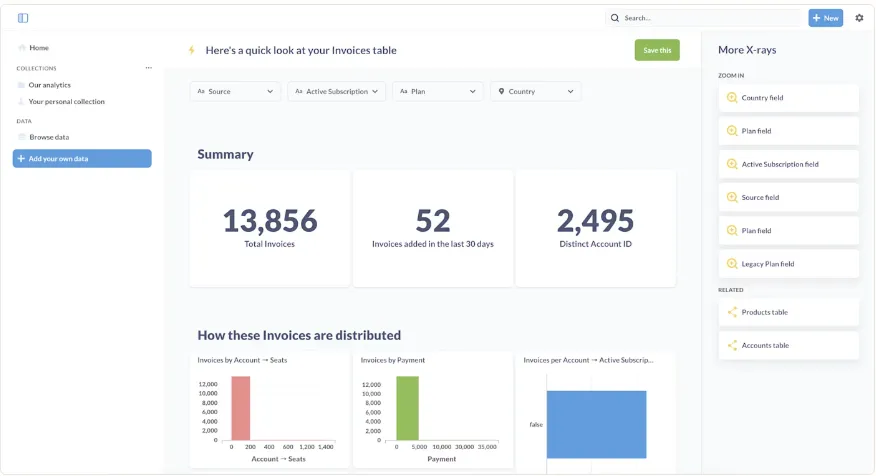
Strengths: free and unlimited when self-hosted, a clean and fast interface, auto-generated dashboards, and a short learning curve.
Limitations: self-hosting means you own the uptime and the upgrades. Visual customisation is limited next to Tableau, and the hosted plans jump in price quickly.
Pricing: open source is free. Starter is US$100 per month (5 users included, US$6 per extra user) and Pro is US$575 per month. See Metabase pricing.
6. Klipfolio
Klipfolio is a dashboarding specialist rather than a full BI suite. Where it wins is pulling many small data sources into one wall-mounted screen of key performance indicators (KPIs), which is why agencies and operations teams like it. Every plan includes unlimited users, so it prices well for a team that mostly needs to look rather than build.
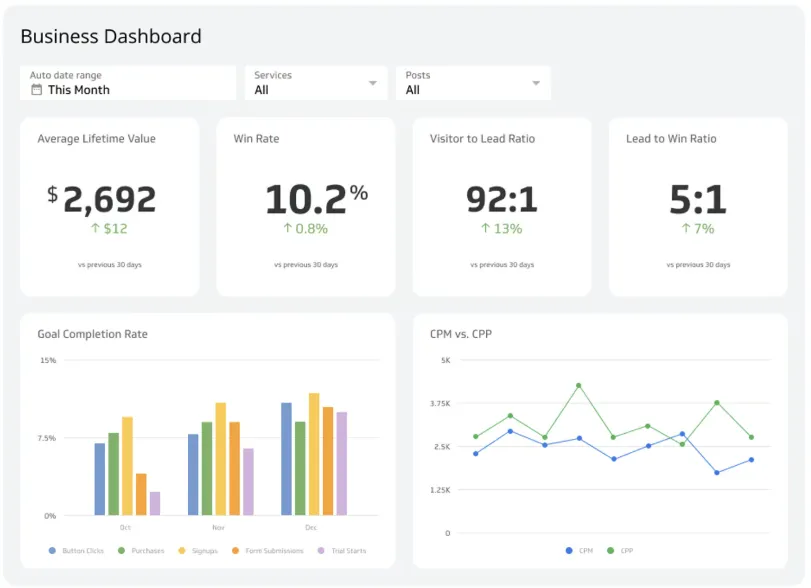
Strengths: unlimited users on every plan, excellent real-time dashboarding, a wide chart library, and strong multi-source support.
Limitations: it is not a full BI platform, deeper customisation expects formula and spreadsheet skill, and the entry price is steep for a two-person team.
Pricing: Klips starts at US$120 per month billed annually (US$140 billed monthly), rising to US$600 per month for Team+. See Klipfolio pricing.
7. Clear Analytics
Clear Analytics exists for one type of buyer: the finance team that will not move off Excel. It turns Excel into a governed, self-service reporting front end and connects into the Microsoft BI stack, so the numbers stay controlled while the analyst keeps the interface they already know.
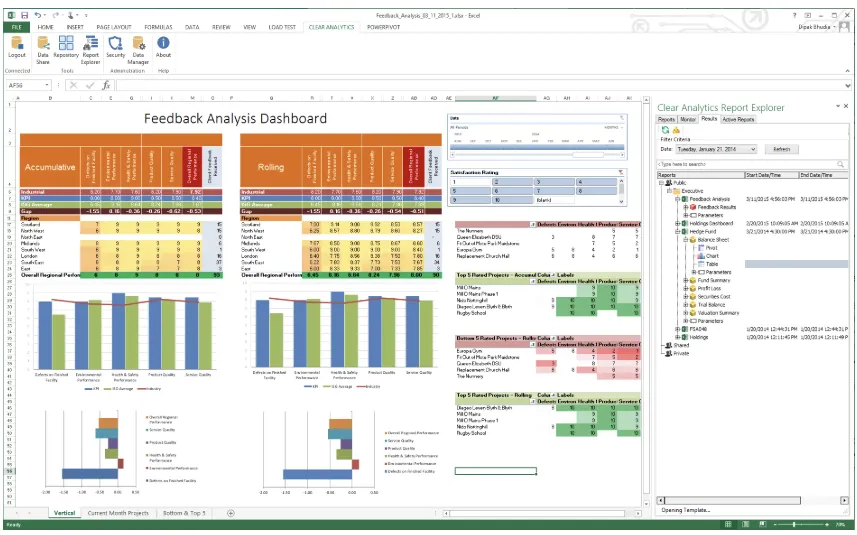
Strengths: effectively zero training cost for Excel users, works alongside Power BI, and brings version control to spreadsheet reporting.
Limitations: limited advanced analytics, a smaller ecosystem than the major platforms, and it inherits Excel's ceiling on data volume.
Pricing: quote-based. See Clear Analytics.
Best business intelligence tools for mid-market and scaling teams
Once reporting stops being one person's job, you need governance, row-level security and the ability to hand a dashboard to someone who will never be trained. These six are built for that stage.
8. Tableau
Tableau remains the benchmark for visual analysis. You drag fields onto a canvas and it responds fast enough that you keep asking questions, which is a different experience from building a report to a spec. It is the right choice when the job is exploring data and presenting a finding, not just publishing a monthly figure.
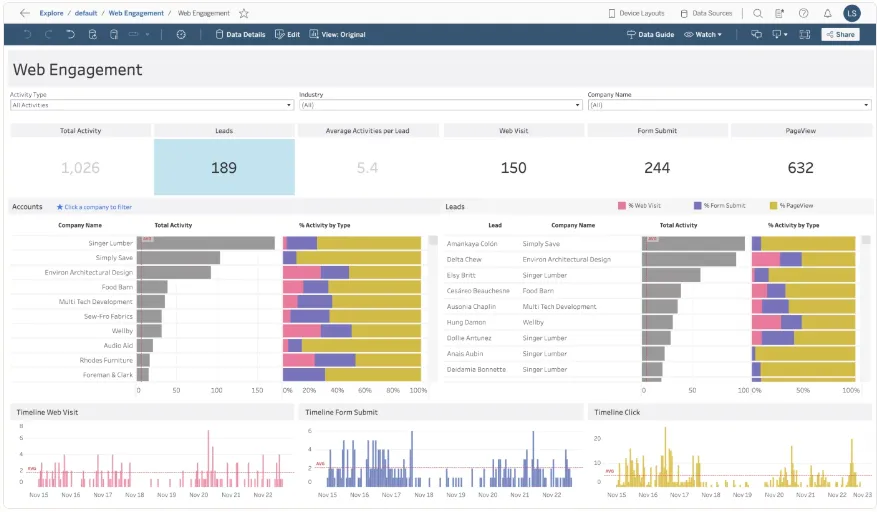
Strengths: best-in-class visualisation, a genuine exploratory workflow, a huge community, and connectors to almost anything. Tableau Desktop now has a free edition for local analysis of Excel, CSV and database files, which makes it easy to evaluate.
Limitations: fewer automated insight features than newer AI-first tools, every deployment needs at least one Creator licence, and the cost climbs steeply once authors outnumber viewers.
Pricing: Tableau Cloud Standard starts at US$15 per user per month and Tableau Enterprise at US$35, both billed annually, with Creator, Explorer and Viewer licence types priced separately within each edition. See Tableau pricing.
9. Qlik Sense
Qlik Sense is built around associative exploration: instead of following a predefined drill path, you click anything and the whole model responds, including showing you which values are not related to your selection. That negative space is genuinely useful when you are investigating a problem rather than reporting a number.
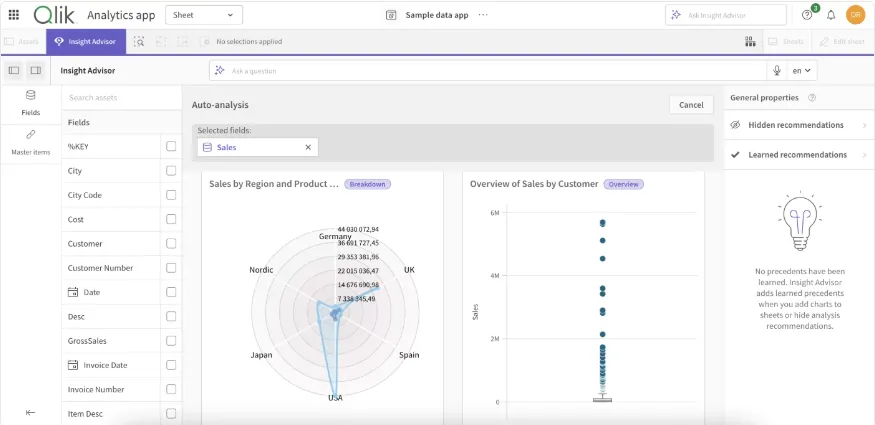
Strengths: the associative engine, a strong AI assistant, a fully native mobile app, and capacity-based pricing that does not punish you for adding viewers.
Limitations: a steep learning curve, and the entry price is well above what most small businesses will approve.
Pricing: Qlik Cloud Analytics starts at US$300 per month for Starter (10 users, 10GB), US$825 for Standard (25GB) and US$2,750 for Premium, billed annually. See Qlik pricing.
10. Domo
Domo is a cloud data platform with BI on top. Its strength is the breadth of its connector library and the speed at which it loads dashboards once the data is in, which makes it a fit for a business pulling from dozens of operational systems at once.
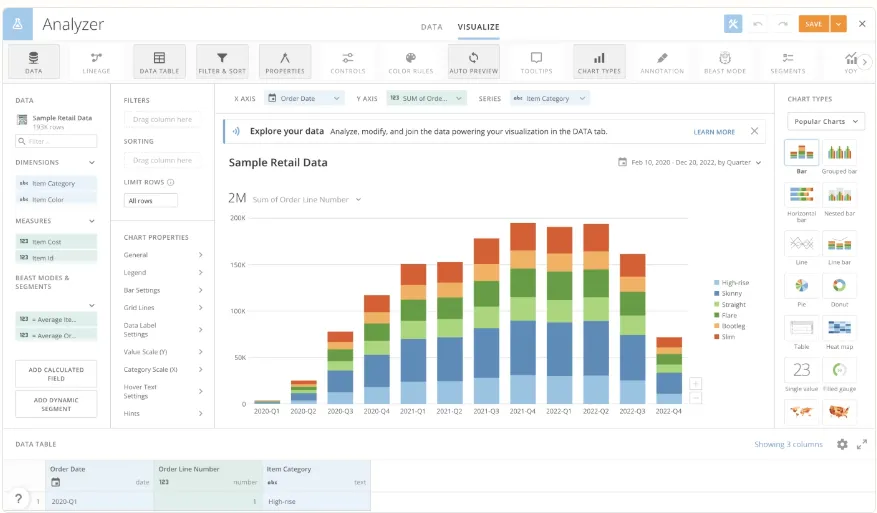
Strengths: a very large connector library, fast load speeds, built-in data workflows and calculations, and strong mobile access.
Limitations: a cluttered interface, and consumption-based billing that can produce an unpredictable invoice if nobody is watching credit usage.
Pricing: quote-based. See Domo pricing.
11. Sisense
Sisense is aimed at embedding analytics inside a product you sell, rather than at internal reporting. Its in-chip processing handles large datasets on modest hardware, and white-labelled dashboards can be shipped inside your own application.
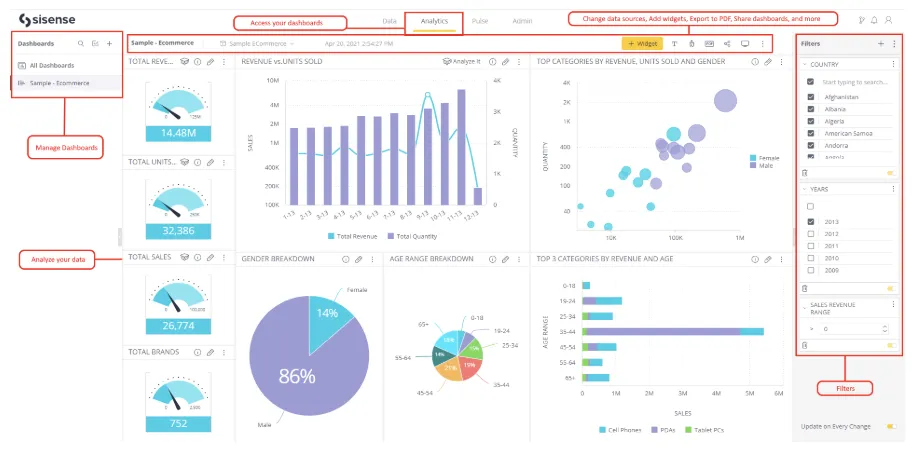
Strengths: strong embedded and white-label analytics, good performance on large datasets, and an application programming interface (API) first design.
Limitations: non-technical users are limited without SQL support nearby, and it is oversized for a company with a handful of data sources.
Pricing: quote-based, with annual contracts. See Sisense.
12. Yellowfin
Yellowfin combines dashboards with automated insight detection and a data storytelling module, so instead of only showing a chart it can flag what changed and let an analyst publish a narrative around it. The no-code and low-code builder keeps it usable for business teams.
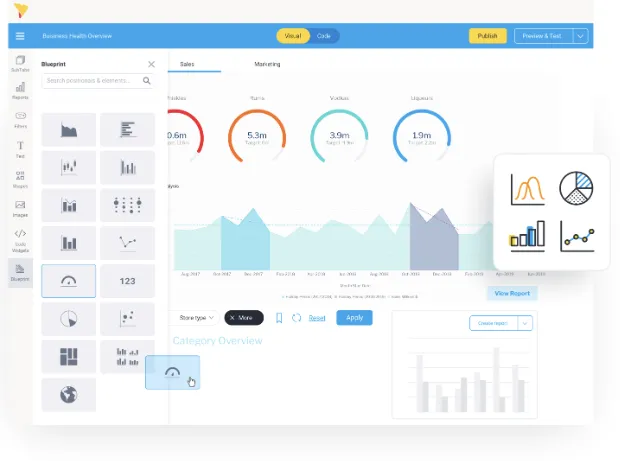
Strengths: automated signal detection, a genuine data storytelling feature, a no-code build environment, and flexible deployment options.
Limitations: a smaller community than the major platforms, and less depth than Tableau or Qlik for complex analytical work.
Pricing: quote-based. See Yellowfin pricing.
13. Logi Symphony (formerly Dundas BI)
Dundas BI no longer exists as a separate product. insightsoftware acquired Dundas and merged its technology into Logi Symphony, a unified embedded analytics platform. Existing Dundas BI licences remain valid inside that platform. If you find a guide still reviewing Dundas BI as a current product, it predates the change.
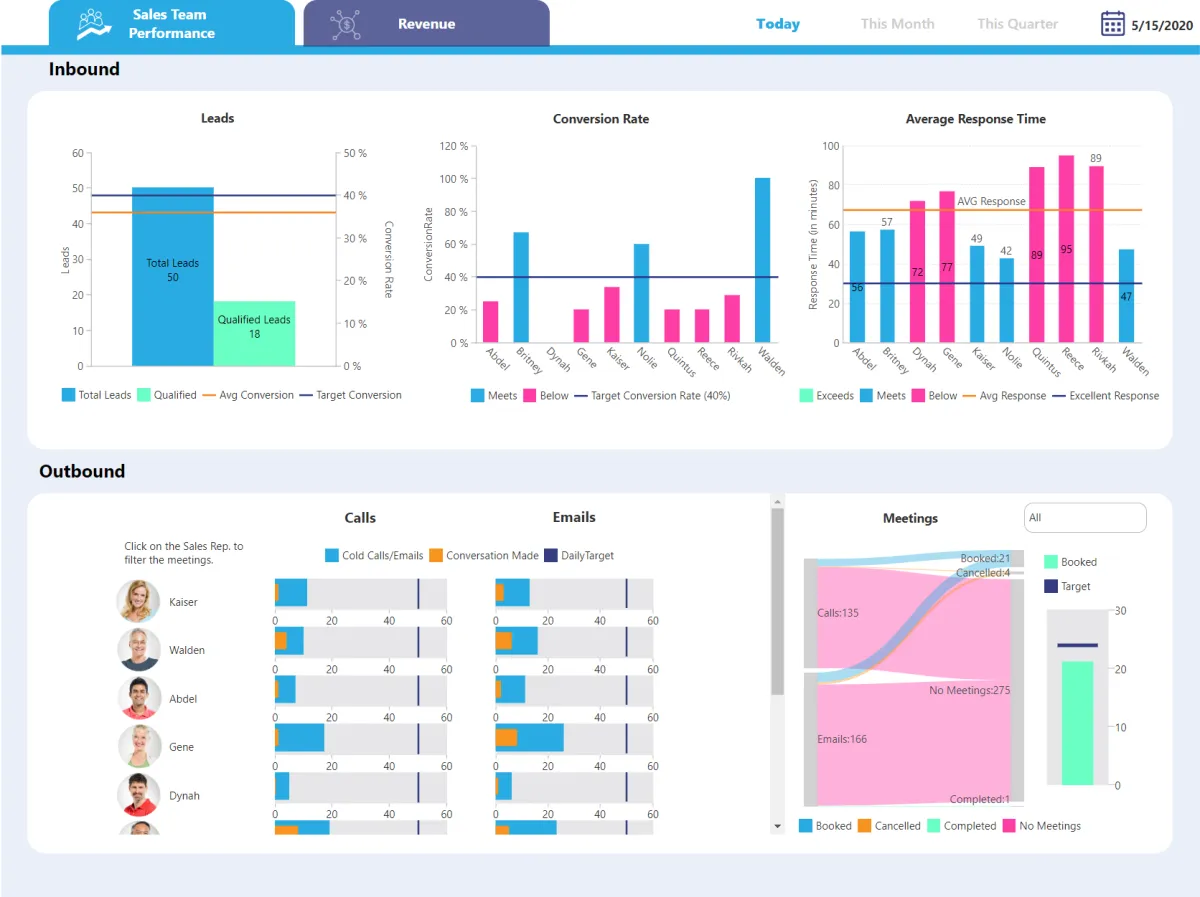
Strengths: drag-and-drop exploration, highly customisable dashboards, and a mature embedded analytics story for software vendors.
Limitations: customers went through a product migration, and pricing is enterprise-level for a small business.
Pricing: quote-based. See Logi Symphony.
Best business intelligence tools for enterprise and specialist analytics
These eight are chosen for reasons that have little to do with the dashboard itself: an existing vendor relationship, a compliance requirement, a statistical workload, or the systems the data already lives in. Most do not publish a price.
14. IBM Cognos Analytics
Cognos is a governed reporting platform with an AI assistant that will surface patterns and build a starting visualisation from a plain-language question. It is aimed at organisations where reports have to be correct, controlled and auditable, not just attractive.
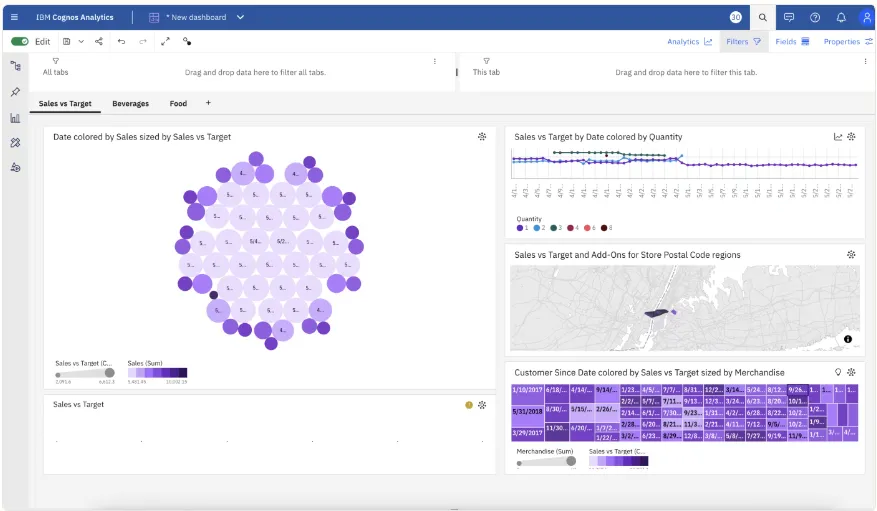
Strengths: a capable AI assistant, strong governance and enterprise reporting, and Microsoft Teams collaboration.
Limitations: a steep learning curve, and it usually needs administrator support to run well.
Pricing: Standard starts at US$10.60 per authorised user per month and Premium at US$42.40, with a free trial. See IBM Cognos Analytics pricing.
15. Oracle Analytics Cloud
Oracle Analytics Cloud makes sense in one situation above all others: your transactional data already sits in Oracle databases or Oracle enterprise resource planning (ERP) software. The integration is the reason to buy it, and the machine learning and natural language features are competitive.
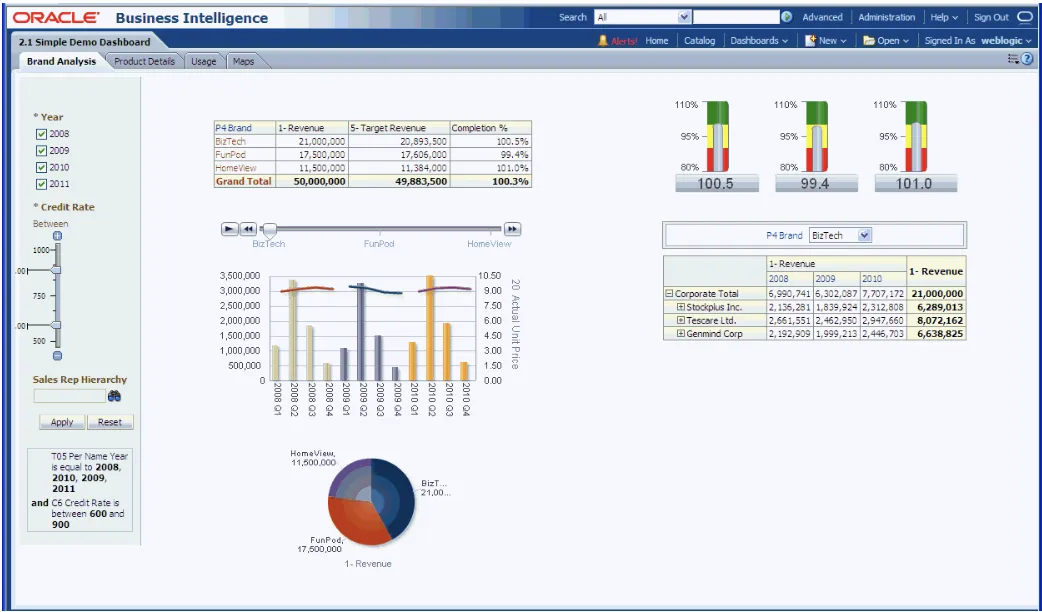
Strengths: deep Oracle integration, handles large data volumes, and offers both per-user and capacity-based licensing.
Limitations: little reason to choose it without an existing Oracle estate, and performance can suffer on large uploads.
Pricing: Oracle publishes a rate card covering per-user and OCPU-per-hour licensing for Professional and Enterprise editions. Confirm your configuration with Oracle before budgeting. See Oracle Analytics pricing.
16. SAP BusinessObjects
SAP BusinessObjects is a long-established enterprise reporting suite, strongest where SAP is already the system of record. Its Web Intelligence reporting and semantic layer are the draw, giving a business a single governed definition of every metric.
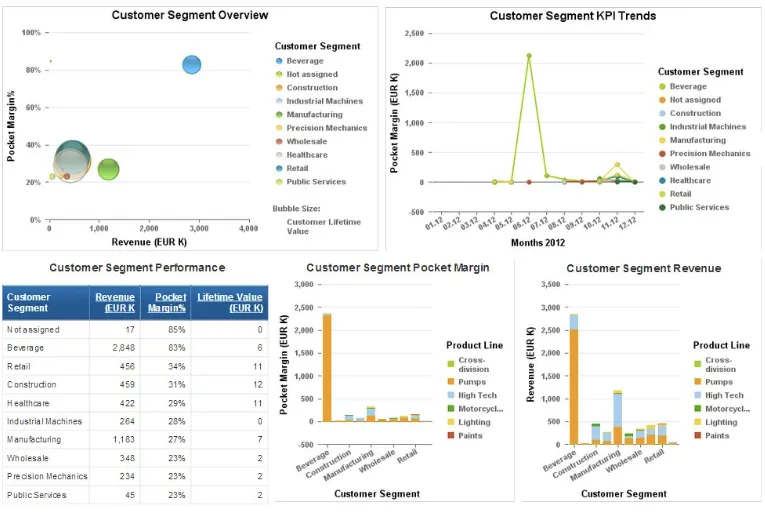
Strengths: a mature semantic layer, strong pixel-perfect and scheduled reporting, and tight integration with SAP systems.
Limitations: heavy to administer, dated interfaces compared with modern cloud BI, and SAP is steering new work towards SAP Analytics Cloud.
Pricing: quote-based, typically an annual enterprise licence. See SAP BusinessObjects BI.
17. Strategy One (formerly MicroStrategy)
MicroStrategy rebranded to Strategy in February 2025, and its analytics platform is now sold as Strategy One. It is built for very large, tightly governed deployments, with a semantic layer designed to serve thousands of users off one definition of the truth.
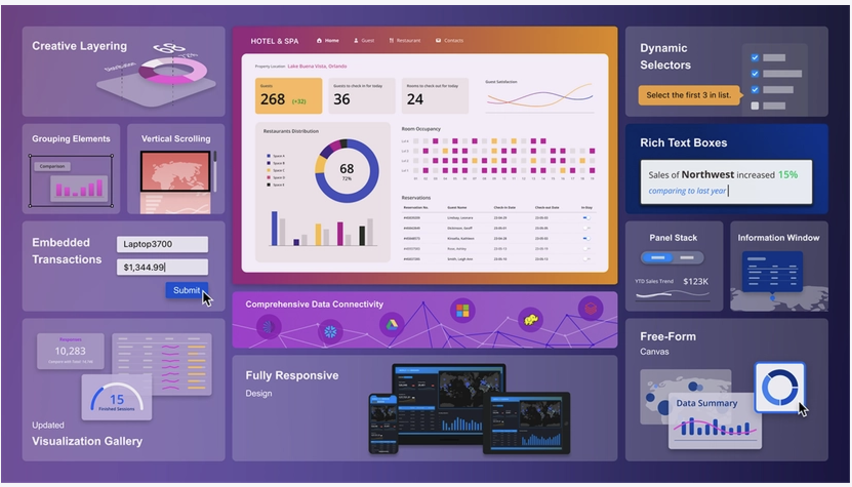
Strengths: enterprise-scale performance, powerful governed dashboards, strong mobile support, and generative AI features.
Limitations: a complex setup, a real learning curve, and it needs dedicated administrators.
Pricing: quote-based. Any "from US$600, one-time licence" figure you see quoted for MicroStrategy is out of date. See Strategy.
18. SAS Viya
SAS is an analytics company first and a dashboard company second. Choose SAS Viya when the requirement is serious statistical work, forecasting or text analytics, and the reporting layer is a by-product of the modelling rather than the point of it.
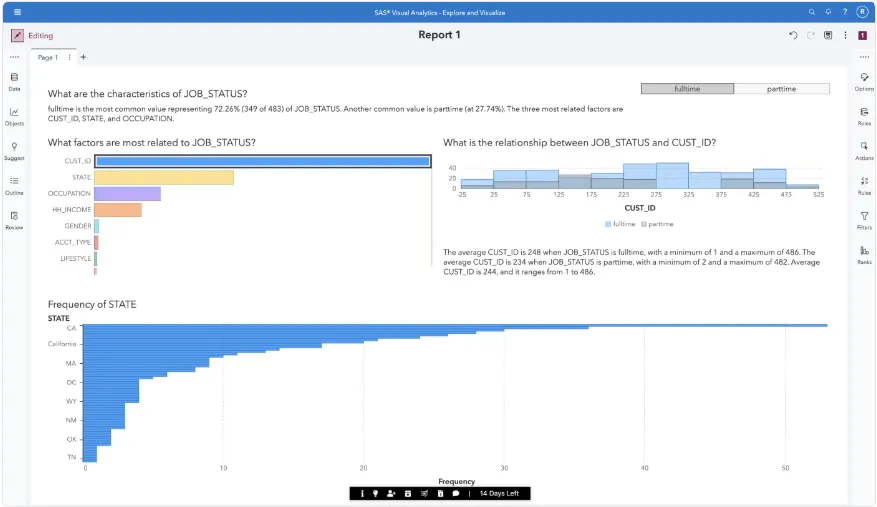
Strengths: exceptional predictive and statistical capability, heavy automation, and highly customisable dashboards.
Limitations: a dated interface in places, slower load times, and a large feature surface that takes time to learn.
Pricing: quote-based, and it varies enormously with deployment size. See SAS Viya.
19. Spotfire
Now sold by Cloud Software Group rather than TIBCO, Spotfire is strongest on real-time and streaming data. If you are analysing sensor output, logistics telemetry or anything where the value decays in minutes, it handles that better than most general BI tools.
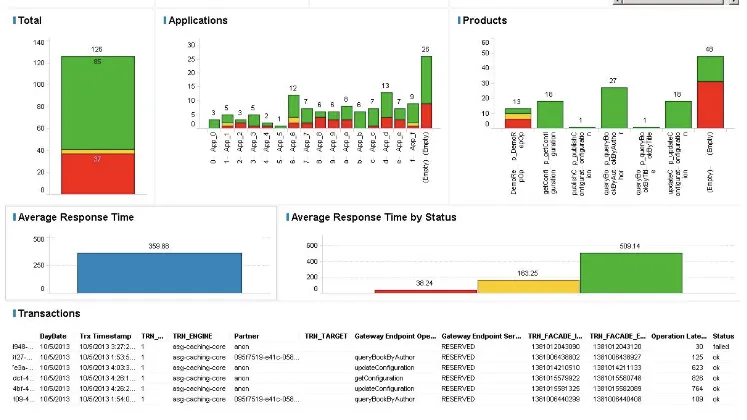
Strengths: excellent real-time and streaming analysis, strong advanced analytics with built-in data science tooling, and a responsive interface.
Limitations: the web version behaves differently from the desktop client, and the default calculation options are limited for cross tables.
Pricing: quote-based, with a free trial. On-premises deployments need a separate server licence. See Spotfire.
20. Mode (part of ThoughtSpot)
Mode is a data science and analytics workspace that ThoughtSpot acquired in 2023. It is built for analysts who work in SQL, Python and R and want to move from a query to a notebook to a shared report without changing tools. It is not a business-user dashboard product.
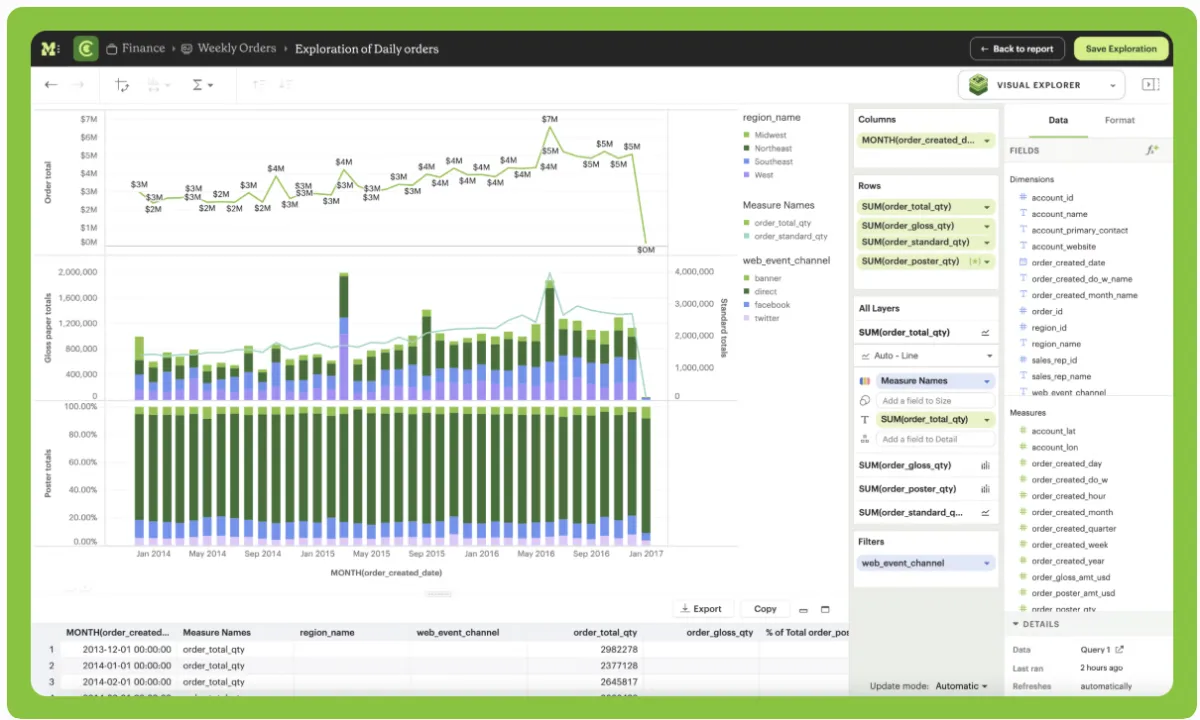
Strengths: a genuinely good analyst workflow, SQL combined with Python and R notebooks, and fast iteration on ad hoc questions.
Limitations: it assumes SQL fluency, so it is the wrong tool for a team without an analyst.
Pricing: quote-based, with a free trial. Mode does not publish plan prices. See Mode pricing.
21. Atlassian Analytics
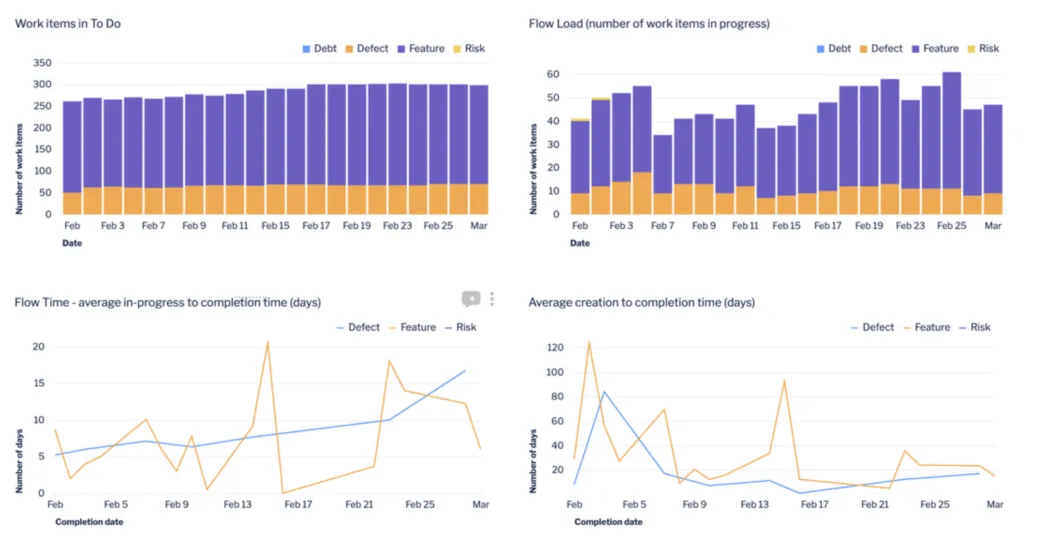
Atlassian Analytics reports on data from Jira, Jira Service Management and Confluence through the Atlassian Data Lake. Its Visual SQL builder lets a non-technical project manager chart delivery data without writing queries. The important caveat, and the thing the original version of this article got wrong, is that it is not a standalone purchase.
Strengths: Visual SQL removes the query barrier, fast to deploy, and it gives delivery teams self-service access to their own data.
Limitations: it only covers Atlassian data well, it lacks depth for serious analysts, and it is gated behind the Enterprise plan.
Pricing: included at no extra cost with Atlassian Cloud Enterprise for Jira, Jira Service Management and Confluence. It is not available on Free, Standard or Premium plans. See Atlassian Analytics.
Free business intelligence tools worth trying first
You do not need a budget to find out whether business intelligence will help you. Three of the tools above are free enough to prove the case on real data before anyone signs anything:
- Looker Studio is free with no user limit. Best if your data is in Google Sheets, Google Ads or GA4.
- Power BI Desktop is free to build and explore in. You only pay when you want to publish and share reports with colleagues.
- Metabase open source is free for unlimited users if you can host it. Best if your data is already in a database.
Zoho Analytics also has a permanent free plan for 2 users and 10,000 rows, which is enough to build a real dashboard rather than a toy one. Start with whichever matches where your data already sits. The tool is much less important than picking the five numbers you will actually check every week.
What is a business intelligence tool?
A business intelligence tool is software that collects data from your business systems, organises it, and presents it as dashboards, reports and charts you can act on. Instead of exporting three spreadsheets and reconciling them by hand, you connect the source systems once and the reporting updates itself.
In practice a BI tool does five jobs:
- Data collection: pulling records from accounting software, sales apps, warehouse systems, spreadsheets and online platforms.
- Data preparation: cleaning, joining and standardising those records so the same customer is not counted three ways.
- Analysis: aggregating, comparing across periods, and in the better tools, forecasting.
- Visualisation: turning the result into charts, tables and dashboards that can be read at a glance.
- Sharing: distributing those dashboards to the people who need them, with the right access controls.
The distinction worth holding on to: a BI tool tells you what happened and where, reliably and without manual work. Whether it also tells you what to do next depends on how well you have chosen the measures. Our guide to the 19 sales KPIs to track for B2B success is a good place to decide that before you configure anything.
Why businesses use business intelligence tools
The benefits get listed a dozen different ways. In our experience with Malaysian distributors, four of them account for almost all of the value:
One version of the numbers
BI tools consolidate data from your accounting system, sales app, warehouse and online channels into one place, so a meeting does not begin with two people disagreeing about the revenue figure. This alone is usually the payback for a smaller business, because it removes the weekly spreadsheet reconciliation entirely.
Reporting that does not wait for a person
Automated, scheduled reports replace the manual export. Nobody has to be in the office for the Monday numbers to exist, and a decision-maker can check a live dashboard instead of requesting a report and waiting two days for it.
Access without technical skill
Modern BI tools are designed so that a sales manager or a warehouse supervisor can answer their own questions. That shifts reporting away from being one bottlenecked person's job, and it means the people closest to the problem are the ones looking at the data.
Earlier warning
Trend analysis and anomaly alerts surface a problem while it is still small: a customer whose order frequency is slipping, a product line whose margin is quietly eroding, a branch falling behind. Catching those in week two rather than at quarter end is where the real money is.
There is a longer list, and it is all true: better customer insight, competitive visibility, cross-platform access, stronger team alignment. But if you are building the business case, build it on the four above. They are the ones you can measure.
How to choose the right business intelligence tool
With this many options, the choice gets easier if you work through it in a fixed order. Answer these six questions in sequence and most of the list eliminates itself.
1. Where does your data actually live?
This decides more than any feature comparison. Google data points to Looker Studio, Microsoft 365 points to Power BI, an Oracle or SAP estate points to their own platforms, and a business running Malaysian accounting software needs a tool that can reach it. Check the connector list before anything else.
2. Who will build the reports?
If the answer is "whoever has time", you need a tool a non-technical person can use, which rules out Mode and makes Sisense hard work. If you have an analyst who writes SQL, you can consider the whole list.
3. What does it cost at twenty users, not two?
Per-user pricing looks cheap on the first invoice and compounds. Power BI at US$14 per user is US$3,360 a year for twenty people. Klipfolio and Qlik include users in the plan, so the arithmetic runs the other way. Model your real headcount, including the viewers who will never build anything.
4. How much automation do you need?
If the goal is to stop doing manual work, check that the tool can schedule data refreshes and report delivery on the plan you are actually buying, not just on the enterprise tier.
5. What are the security and access requirements?
Look for encryption, role-based access and row-level security, so a branch manager sees their branch and not the whole company. If you handle customer data, confirm how the vendor treats it and where it is stored.
6. Can you get support in your timezone?
This is underrated and it is why a locally supported option is worth considering. A dashboard that breaks on a Monday morning in Penang is not helped by a support queue that opens in California at 9am Pacific.
Then run a free trial with your own data, not the vendor's demo dataset. Every tool looks good on a prepared sample. The real test is whether your messiest data source connects without a project.
Getting your data ready before you buy anything
The most common reason a BI project stalls in a Malaysian SME is not the tool. It is that the underlying data is spread across a desktop accounting system, a WhatsApp order thread and a stock count in someone's notebook. A dashboard cannot fix that, it can only display it.
Before you commit to a platform, it is worth checking that the operational systems feeding it are capturing clean data in the first place. Orders taken through a mobile sales app arrive structured and time-stamped, stock movements recorded in a warehouse management system reconcile against sales, and figures held in SQL accounting software can be read directly by most BI tools. We cover this groundwork in more detail in how to use sales and accounting data to drive smarter business decisions.
Two other things worth doing first: confirm your systems can talk to each other, which our notes on app integration cover, and make sure your invoicing is compliant, since e-invoicing changes how transaction data is captured. See Malaysia e-Invoice 2026: what wholesale businesses need to know. If you want to see where automation helps beyond reporting, our roundup of the top AI tools for small businesses in Malaysia and our guide to implementing AI in your accounting software are the natural next reads.
Let BI software do the hard work
Business intelligence tools are worth the effort, but only after you have decided what you want to know. The businesses that get value from them start with a short list of questions, pick the cheapest tool that can answer those questions against the data they already hold, and expand from there.
If you are starting from nothing, begin with a free option: Looker Studio if your data is in Google, Power BI Desktop if it is in Excel, Metabase if it is in a database, Zoho Analytics if you want ringgit pricing and a free plan on the same platform you will eventually pay for. Run it for a month on real numbers. If the dashboard changes a decision you would otherwise have made on instinct, you have your business case, and the paid tools above are worth a proper evaluation. If nobody opens it, no licence would have fixed that.
If you would rather have the reporting set up for you against your existing sales and stock data, talk to our team about HeroDashboard.

Frequently asked questions
What is the best business intelligence tool for a small business?
For most small businesses it is Microsoft Power BI or Zoho Analytics. Power BI wins if you already run Microsoft 365, because Power BI Desktop is free to build in and your team knows Excel. Zoho Analytics wins if you want ringgit pricing, a free plan for 2 users, and connectors to non-Microsoft business apps. Both can produce a working dashboard in under a week without a data analyst.
Are there free business intelligence tools?
Yes. Looker Studio is free with no user limit, Power BI Desktop is free for building and exploring reports, and Metabase open source is free for unlimited users if you can host it yourself. Zoho Analytics offers a permanent free plan for 2 users and 10,000 rows. The paid tiers in each case mostly unlock sharing, scale and support rather than the core analysis.
How much do business intelligence tools cost in Malaysia?
Entry-level plans start at around RM96 per month for Zoho Analytics Basic or US$14 per user per month for Power BI Pro. Mid-market platforms such as Qlik Sense start at US$300 per month and Klipfolio at US$120 per month. Enterprise platforms including Sisense, Domo, SAP BusinessObjects and Strategy One do not publish prices and are quote-based, usually on annual contracts. Budget for implementation time as well as licences, since that is often the larger cost in the first year.
Power BI or Tableau: which should I choose?
Choose Power BI if cost and Microsoft integration matter most. It is far cheaper per user, Power BI Desktop is free, and it connects natively to Excel and Microsoft 365. Choose Tableau if visual exploration is the actual job, because its analysis workflow and chart quality are still stronger. A useful rule: Power BI for publishing the numbers a business runs on, Tableau for investigating why those numbers moved.
Do I need a data analyst to use a business intelligence tool?
Not for most of the tools on this list. Power BI, Zoho Analytics, Looker Studio, Metabase, Klipfolio and HeroDashboard are all designed for business users, and someone comfortable with pivot tables can build a useful dashboard. You do need analyst skills for Mode, and you will get much more from Sisense, Qlik Sense and the enterprise platforms if someone on the team can write SQL.
What is the difference between a BI tool and a dashboard tool?
A dashboard tool such as Klipfolio displays metrics you have already defined. A full BI platform also prepares the data, models relationships between sources, applies access controls and supports deeper analysis. If your need is a wall screen showing ten agreed numbers, a dashboard tool is cheaper and faster. If people will ask questions the dashboard was not built to answer, you need the BI platform.